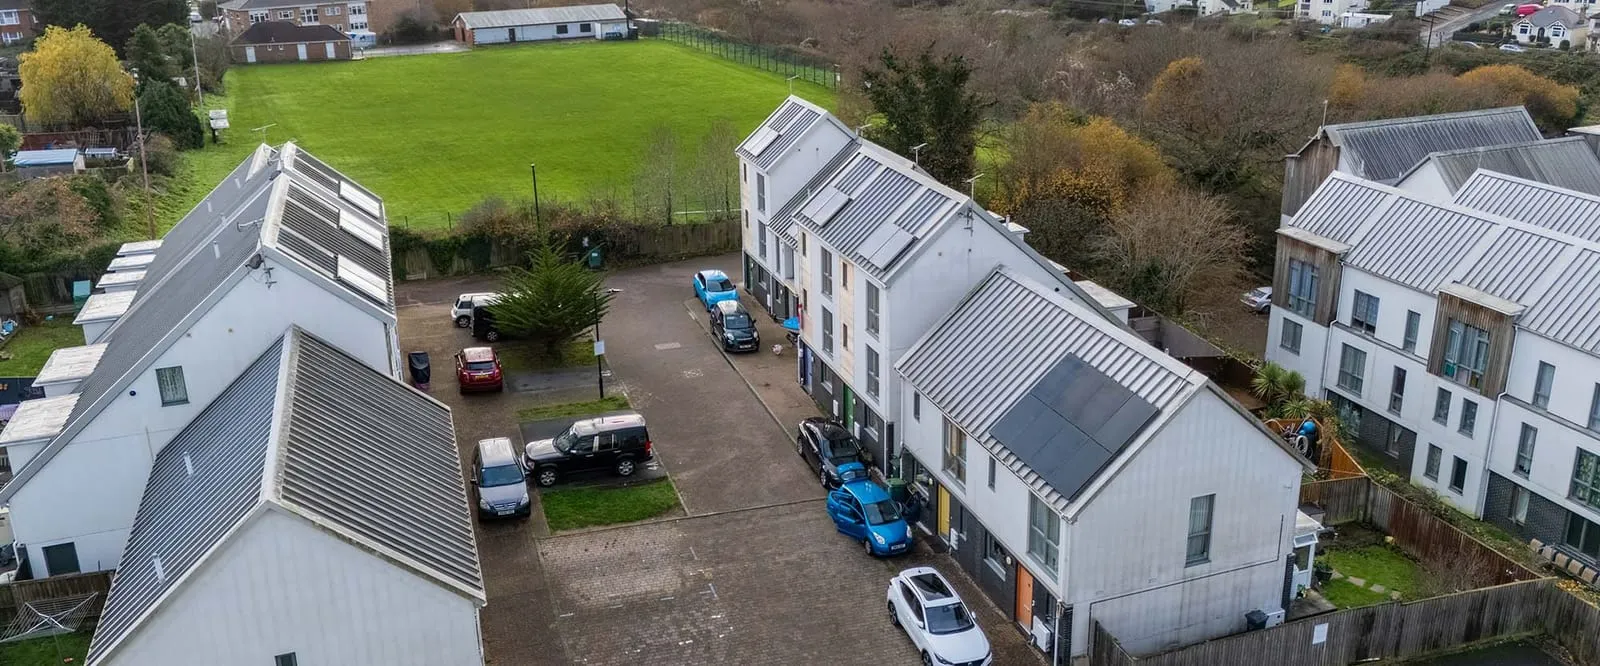
Oxford’s skyline sells the postcard version of the city — spires, quads, honey-coloured stone that no planning officer will ever let you cover in panels. But that isn’t where the city’s commercial solar opportunity actually sits. It’s on the flat, modern, low-rise roofs of the science and business parks that ring the city, and on the industrial sheds that keep the local economy running. For a city of 152,450 people with an outsized concentration of life-sciences, tech and advanced manufacturing tenants, the maths on commercial solar in Oxford is less about the cathedral and more about the shed roof — and it’s worth doing properly before you get a quote.
The national £900–£1,200/kWp band — and where Oxford actually sits in it
The standard UK benchmark for commercial solar in 2026 is roughly £900–£1,200 per installed kWp, falling as system size climbs into the hundreds of kilowatts through economies of scale on panels, inverters and scaffolding-free flat-roof mounting. You can see how that band is built up, and how it flexes with roof type and system size, on the national cost breakdown at commercialsolarcostuk.co.uk, which is the closest thing the sector has to an independent benchmark rather than a single installer’s price list.
Oxford’s commercial roof stock actually plays in the installer’s favour more often than the “historic city” reputation suggests. Sites like Oxford Science Park, Begbroke Science Park and Harwell Campus are large modern low-rise developments with big, unshaded, structurally straightforward flat roofs — exactly the roof type that pulls a quote toward the bottom of that £900–£1,200/kWp band rather than the top. Oxford Science Park and Harwell Campus in particular host major life-sciences and energy-research clusters, meaning a meaningful share of the tenant base already has an institutional reason — lab accreditation, ESG reporting to investors or parent companies, net-zero-linked funding conditions — to want a metered, verifiable renewable generation asset on the roof rather than just a lower bill. That changes the buying conversation from “is this worth it” to “how fast does it pay back,” which is the more useful question anyway.
Where Oxford does add cost is in the pockets of genuinely constrained sites: multi-storey car parks, listed or semi-listed commercial buildings near the centre, and anywhere access requires a road closure or a crane booking through the council rather than a straightforward site delivery. For those, budget toward the top of the national band, or look at ground-mounted or car-park canopy alternatives — solar carport structures are a genuinely useful option for science-park and business-park sites with large surface car parks and constrained roof area, since they generate power without competing for roof space at all.
The South East sits at the strong end of the UK’s solar yield map — around 1,000 kWh per installed kWp per year, against a national typical range of 850–1,050+. That’s meaningfully better than the Midlands or the north, and it’s one genuine local advantage Oxford businesses have over most of the country: the same-sized system produces more usable electricity here than it would almost anywhere outside the far south coast.
Modelling the payback against a typical Oxford commercial energy bill
Local commercial energy spend for a mid-sized Oxford business — a lab, light manufacturer, hotel or office occupier of the kind found across the science parks and the wider city — runs in the region of £50,000 a year. At a typical commercial import rate in the low-to-mid 20s pence per kWh, that implies annual consumption somewhere around 180,000–200,000 kWh.
A 100 kWp system on a South East roof at ~1,000 kWh/kWp/yr generates roughly 100,000 kWh annually. For a business with daytime-weighted demand — labs, workshops, kitchens, offices — self-consumption of that generation typically runs somewhere in the 50–70% range without a battery, so call it 55,000–70,000 kWh displacing grid import directly at up to ~25p/kWh: roughly £13,750–£17,500 a year in avoided purchase. The surplus exports under a Smart Export Guarantee tariff, which varies by supplier but tops out around 12–20p/kWh, adding perhaps £4,000–£8,500 depending on export volume and the tariff secured. Put together, total annual value is commonly in the region of £18,000–£25,000 for a system of that size.
Against an installed cost of roughly £90,000–£120,000 at the £900–£1,200/kWp benchmark, that puts simple payback at somewhere around 4–6 years — comfortably inside the 20–25+ year working life of a modern panel installation, and well within the 0% VAT window that currently applies to residential solar and battery storage (commercial installs sit under separate VAT treatment, so get that confirmed with your accountant and installer rather than assuming it carries across). Adding a battery to capture more of that daytime generation for evening use pushes the capital cost up — commercial battery storage typically adds meaningfully to the bill — but can also lift self-consumption well above the unbattered range, which is worth modelling separately rather than bundling into a single “solar” quote. You can run your own numbers, adjusted for your actual roof and bill, against a general payback framework here or against commercial-specific cost data.
Financing without tying up capital
Not every Oxford business wants to write a six-figure cheque for a roof asset, and it doesn’t have to be the only route in. Asset finance spreads the capital cost against the savings the system generates, which is worth comparing directly with a cash purchase — asset finance structures for solar let you weigh the total cost of borrowing against the payback timeline above. Power purchase agreements go further, putting someone else’s capital on your roof entirely: a third party owns, funds and maintains the system, and you simply buy the electricity it generates at a rate below your current import price, with no capital outlay and no balance-sheet asset. How that structure works in practice is worth reading before ruling it out, particularly for larger science-park tenants who’d rather keep capital in R&D than in racking. For businesses layering in a battery to chase that higher self-consumption figure above, commercial battery storage financing and sizing is the place to start that separate conversation, and commercial solar finance more broadly covers how lenders are currently pricing renewable energy assets against more conventional business loans.
The net-zero backdrop is doing real work here
Oxford City Council has set a net-zero target for the city by 2040, sitting inside the wider Oxford Zero Carbon Action Plan, and runs its Sustainable Oxford programme to support businesses and residents moving toward it. The council has also backed decarbonisation work at the BMW Mini plant in the city — a visible sign that industrial-scale energy transition isn’t an abstract policy line here, it’s happening on a major local employer’s own site. None of that obliges any individual business to install solar, but it does mean the direction of travel — tighter EPC and reporting expectations, tenant and investor pressure on carbon disclosure, procurement conditions from public-sector and research-funded clients — is only going to tighten between now and 2040, not loosen. Installing now, while the 0% VAT window on the residential side is still open and before any future tightening of commercial incentives, is a reasonable hedge against paying more to do the same thing later. It’s also worth noting Oxford’s strong local property market — average house prices around £490,000 — reflects broader demand pressure across the city’s commercial and residential stock alike, and landlords with an eye on tenant demand and EPC compliance are increasingly treating an on-site generation asset as part of a building’s market position, not just its running costs.
Who’s actually doing the installs
For businesses on or near the science parks, commercial solar installation in Oxford is the sensible starting point for scoping a system against the city’s specific roof stock and grid connection realities — DNO capacity checks in particular are worth doing early for anything over about 50 kWp, since parts of the Oxfordshire network are more constrained than others. Regionally, Home Counties-based SOLA UK covers South East commercial and domestic solar installs and is a reasonable point of comparison for a second quote if you’re weighing a local specialist against a national outfit. For businesses on the East Anglia side of the M40/A34 corridor with commercial and battery requirements similar to Oxford’s, ECO Eco Energy’s commercial solar and battery work is another useful reference point on how a regional installer prices and scopes multi-tenant commercial sites. And once a system is in, don’t treat it as fit-and-forget — a maintained 25-year asset earns its keep for the full quarter-century; a neglected one degrades faster than the quoted 0.4%/year and can lose output silently for months before anyone notices, which is where a dedicated O&M specialist earns its retainer on larger commercial arrays.
If your site is an industrial unit or distribution shed rather than a science-park office, the roof-type economics differ slightly again — industrial unit solar covers the specific considerations for large single-span steel-portal roofs, which are common across Oxford’s outer industrial estates and generally cheaper per kWp to fit than a multi-level office building.
Getting from interest to an actual number
The honest starting point for any Oxford business is your own half-hourly meter data, not a national average. Pull twelve months of consumption, work out your daytime-weighted load shape, and use that — rather than the £50,000/yr figure used here as an illustrative anchor — to size a system against real usage. From there, get at least two quotes benchmarked against the national £900–£1,200/kWp range, ask each installer to show their DNO connection assumptions in writing, and model payback against both a cash purchase and a PPA before committing to either. For the wider market context behind those numbers — where UK commercial solar pricing has moved through 2026 and why — the current state of the UK solar industry is worth a read, and if you want the domestic-side comparison for context, how UK solar costs break down more generally and a working payback calculator sit alongside this piece. Whatever you install, a properly maintained system is what makes the 25-year payback story real — maintenance basics for UK solar arrays are worth reading before you sign, not after something stops generating.
None of this needs to be an act of faith. Oxford has the roof stock, the yield, and — thanks to the science-park tenant base and the council’s 2040 target — the institutional appetite for commercial solar to make straightforward financial sense on its own terms, without leaning on subsidy or sentiment to close the case.